
14,000+ Acres of Maryland Farmland at Risk, UMD Tool Reveals
Climate-Smart Agriculture Dashboard highlights saltwater intrusion threats, offering vital data for farmers and policymakers.
As the sea level rises along the coasts, saltwater intruding upon freshwater soils poses a growing threat to Maryland farmland. Now, a new Climate-Smart Agriculture Dashboard developed by the University of Maryland’s Climate Resilience Network provides the clearest picture yet of the scale and spread of this threat.
The interactive tool reveals that over 14,000 acres of cropland are already highly vulnerable, with staple crops like corn and soybeans at greatest risk. In some Eastern Shore counties, all farmland is rated at moderate to high vulnerability.
“When cropland is described as 'highly vulnerable,' it means that the farmland is in a place where the aquifer underneath is more likely to become salty in the future, especially if the sea level continues to rise or if groundwater is pumped out at a higher rate,” said Kara Mobley, senior faculty specialist in the Geographical Sciences Department, “In practice, this means the soil and groundwater in those areas are at greater risk of becoming unsuitable for farming and irrigation in the coming years.”
Mobley is a key investigator on the University of Maryland Climate Resilience Network, a Grand Challenges-funded project that unifies the expertise of UMD’s scientists with the immediate requirements of Maryland’s decision-makers to address the complexities of climate change. Her team has developed the Climate-Smart Agriculture Dashboard, an interface that brings together essential data and maps to highlight specific vulnerabilities that can impact agricultural resilience, such as sea level rise, coastal flooding, precipitation and temperature extremes, erosion, groundwater availability, and more.
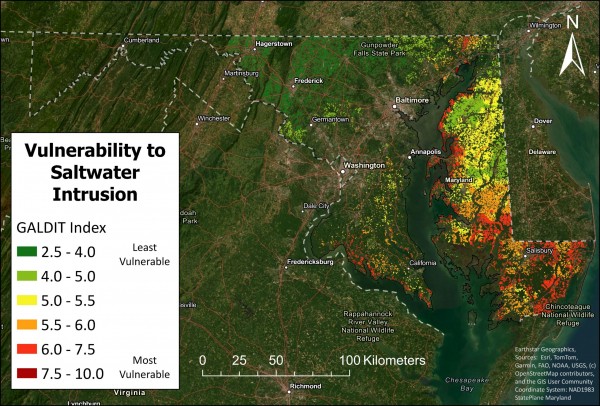
Recently, the dashboard was updated to include a new dataset on saltwater intrusion into aquifers. Mobley and her team created a method that considers six environmental factors that affect saltwater intrusion: groundwater type (confined or unconfined aquifers), aquifer conductivity (how easily water moves through the aquifer), water level relative to sea level, distance to the shoreline, existing salt impact, and aquifer thickness. These factors are combined into a single score that shows which areas are more or less at risk of saltwater intrusion.
As saltwater reaches farther inland, the dashboard offers farmers, researchers, and policymakers a critical resource for understanding and responding to this accelerating challenge.
“Farmers could use the vulnerability map to see if their wells might be at risk and start thinking about drought-tolerant crops or other water sources. County planners could use this information to decide where to focus groundwater monitoring and how to guide land use in coastal areas. Policymakers could use it to shape statewide groundwater management plans and guide future legislation.” said Mobley.
This tool is entirely publicly available on the Climate Resilience Network website. Users can also view detailed source information for each dataset and download them directly from the dashboard in feature or tile layer formats for further analysis.
Next, the team hopes to integrate data analyzing solar panel installations on crop fields across Maryland.
“Recently, the state imposed legislation restricting solar panel installations to 5% of prime agricultural land,” said Mobley, “We are interested in mapping the rate of installation over the past ten years, predicting what the rate will be for the next 5 to 10 years, and determining what economic implications this might have in terms of crop production and food prices.”
Image: A screenshot of the map tool. The least vulnerable countries are in green, the most vulnerable counties are in red.
This article was written by Cazzy Medley and originally published on the Climate Resilience Network website.
Published on Mon, 10/06/2025 - 09:49