
New High-Resolution Maps Reveal Greater Details of Crop Fields Across the U.S.
New 10-meter maps provide a more detailed view of U.S. cropland, improving crop monitoring and analysis.
Researchers from the Global Land Analysis and Discovery (GLAD) team at the University of Maryland have developed a high-resolution crop mapping dataset that provides annual 10-meter maps of corn and soybeans across the contiguous United States from 2019 to 2022.
The study, recently published in the journal Earth System Science Data, shows how advances in satellite data and machine learning can improve the ability to monitor agricultural systems at large scales.
Using Sentinel-2 satellite imagery, the team created 10-day composite datasets and extracted patterns over time to train national-scale computer models. The models were trained using extensive field data collected through a structured sampling design, enabling consistent and reliable crop classification across diverse agricultural regions.
The resulting maps achieved overall accuracy rates of more than 95%, with strong performance for both corn and soybeans. Compared with widely used 30-meter datasets such as the U.S. Department of Agriculture’s Cropland Data Layer, the new 10-meter maps reduce mixed pixels — a common issue in satellite imagery — particularly in regions with smaller or more fragmented fields. This improves both spatial detail and classification reliability.
"The work highlights the growing potential of high-resolution satellite data for crop monitoring, yield estimation, and agricultural decision-making," said Ph.D student Haijun Li, lead author of the paper. "As more data from Sentinel-2 and similar satellite missions become available, these approaches are expected to play an increasingly important role in agricultural sustainability and food security research."
The dataset is publicly available.
Paper: Li, H., Song, X.-P., Adusei, B., Pickering, J., Lima, A., Poulson, A., Baggett, A., Potapov, P., Khan, A., Zalles, V., Hernandez-Serna, A., Jantz, S. M., Pickens, A. H., Ortiz-Dominguez, C., Li, X., Kerr, T., Song, Z., Turubanova, S., Bongwele, E., Kondjo, H. K., Komarova, A., Stehman, S. V., and Hansen, M. C.: An accurate 10 m annual crop map product of maize and soybean across the United States, Earth Syst. Sci. Data, 18, 2227–2249, https://doi.org/10.5194/essd-18-2227-2026
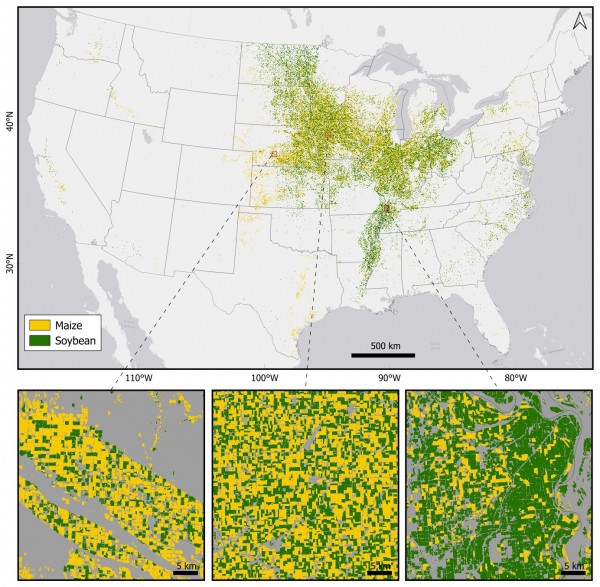
Image: This crop map reveals well-known spatial patterns of maize and soybean cultivation in the United States. The dominant soybean cultivation is shown in the Midwest states, the Great Plains states, the Mississippi Valley and the eastern coast, whereas maize is widely distributed across the country. Background base map source: Esri
Published on Fri, 03/27/2026 - 11:05