UMD College of Behavorial & Social Sciences UMD College of Behavorial & Social Sciences
MENU

Topbar Menu

  • About Us
  • People
  • Alumni and Giving
  • Diversity
  • Undergraduate
    • Prospective Students
    • Courses & Facilities
    • Advising
    • Special Programs
    • Graduation
    • Geography Club
  • Graduate
    • Prospective Ph.D. Students
    • Graduate Courses
    • Graduate Student Publications
    • Graduate Student Awards
    • Graduate Students
    • Master of Science and Graduate Certificate Programs
    • Combined BS/MS Program
  • Research
    • Research Areas
      • Geospatial-Information Science and Remote Sensing
      • Human Dimensions of Global Change
      • Land Cover and Land Use Change
      • Carbon, Vegetation Dynamics and Landscape-Scale Processes
    • Centers
      • Center for Geospatial Information Science
      • International Center for Innovation in Geospatial Analytics & Earth Observation
  • High School Hub
    • Program Overview
    • High School Awards
    • High School Internship Program
    • GIS Day
  • Resources
    • Graduate Student Organization
    • Student Life
    • Graduate School
    • Responsible Conduct of Research
    • Emergency Preparedness
    • Job Opportunities
    • Graduation
Search

Main navigation

  • Undergraduate
    • Prospective Students
    • Courses & Facilities
    • Advising
    • Special Programs
    • Graduation
    • Geography Club
  • Graduate
    • Prospective Ph.D. Students
    • Graduate Courses
    • Graduate Student Publications
    • Graduate Student Awards
    • Graduate Students
    • Master of Science and Graduate Certificate Programs
    • Combined BS/MS Program
  • Research
    • Research Areas
      • Geospatial-Information Science and Remote Sensing
      • Human Dimensions of Global Change
      • Land Cover and Land Use Change
      • Carbon, Vegetation Dynamics and Landscape-Scale Processes
    • Centers
      • Center for Geospatial Information Science
      • International Center for Innovation in Geospatial Analytics & Earth Observation
  • High School Hub
    • Program Overview
    • High School Awards
    • High School Internship Program
    • GIS Day
  • Resources
    • Graduate Student Organization
    • Student Life
    • Graduate School
    • Responsible Conduct of Research
    • Emergency Preparedness
    • Job Opportunities
    • Graduation
  • About Us
  • People
  • Alumni and History
  • Diversity

Search our site:

CGIS Students Create Online Maps to Track US COVID-19 Cases by County

Breadcrumb

  • Home
  • Featured Content
  • CGIS Students Create Online Maps To Track US COVID-19 Cases By County
US map with Covid-19 case hotspots

Faculty members and students in the Center for Geospatial Information Science in the College of Behavioral and Social Sciences have worked together to create two maps to show positive COVID-19 cases in the United States. Dr. Junchuan Fan and Yao Li have created the map visualizations. Hai Lan, Jeff Sauer, Zhiyue Xia, and Guimin Zhu also assisted with data collection, preprocessing and organization. 

US map with Covid-19 hotspots

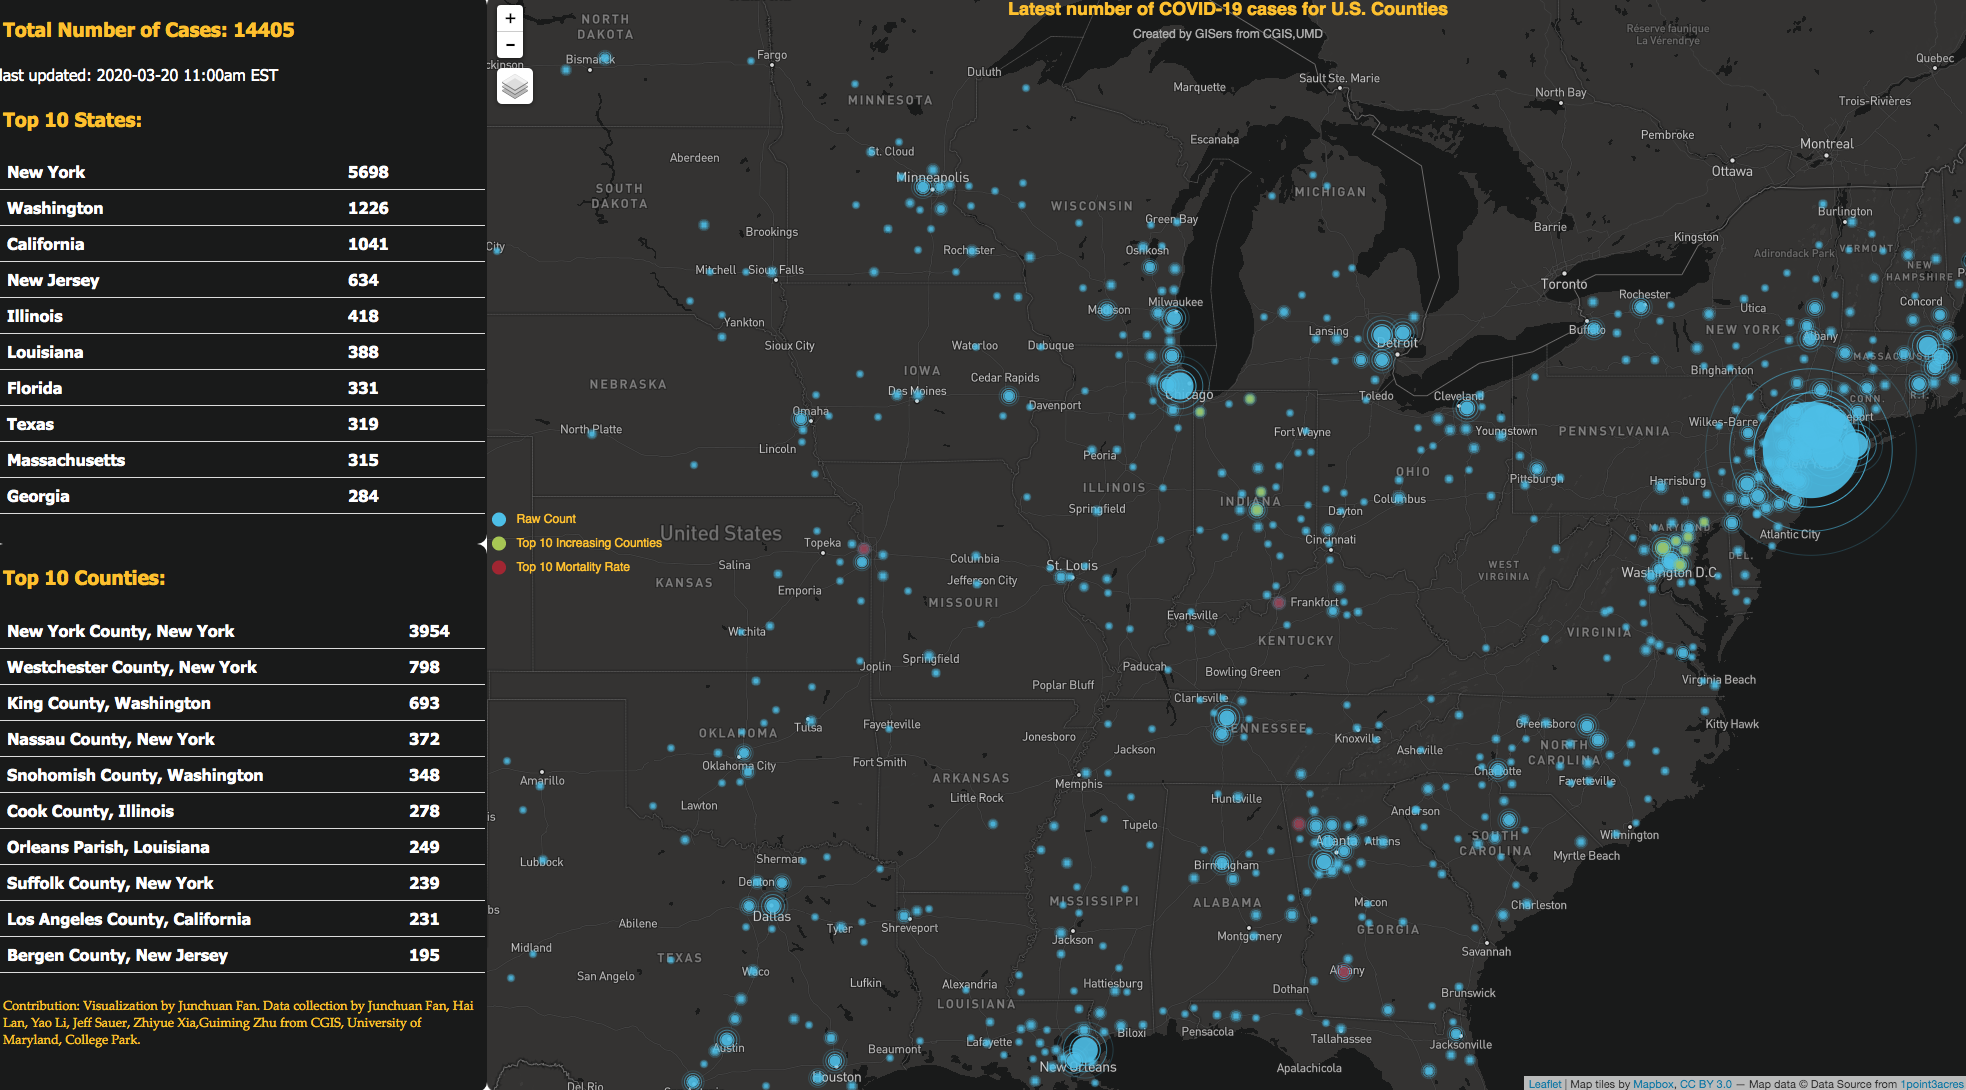
The point map shows the latest number of COVID-19 cases for U.S. counties. The left side shows the total number of cases, latest time stamp update, as well as the top 10 states and counties with the most reported positive cases. It was created using open source geovisualization tools including Leaflet, Mapbox and echarts. The data are downloaded from a public website called 1point3acres. Their data are collected from the latest news reports and then verified by volunteers.

View the Point Map

Contribution: Visualization by Junchuan Fan, CGIS, University of Maryland, College Park.

Data source: 1Point3Acres


US Covid-19 cases

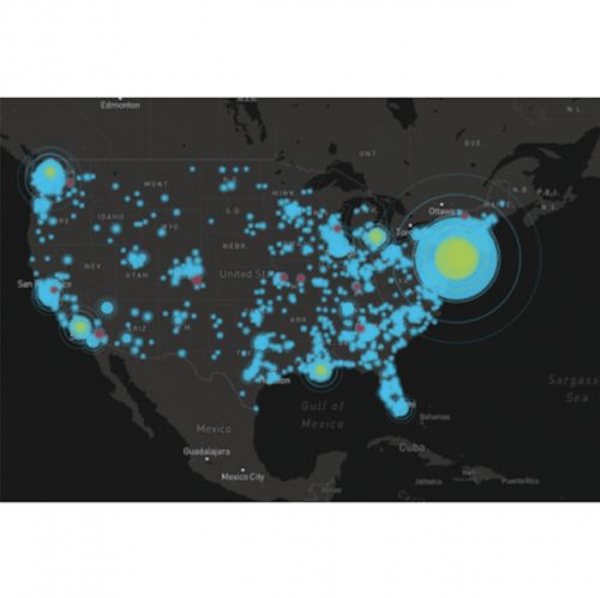
The polygon map shows a timeline of positive COVID-19 cases across the US. The user can toggle the bar across the bottom of the map to change the date and see the total number of cases on a particular day, with a visualization of the positive cases that darken in color as the numbers rise. The map was created CGIS graduate student Yao Li and also uses data from 1Point3Acres.  D3 is used for the visualization of the data. 

View the Polygon Map

Contribution: Visualization by Yao Li. Data collection also assisted by Junchuan Fan, Hai Lan, Yao Li, Jeff Sauer, Zhiyue Xia, Guimin Zhu from CGIS, University of Maryland, College Park

Data source: 1Point3Acres

Published on Tue, 03/24/2020 - 10:31

College of Behavorial & Social Sciences
  • Facebook
  • Twitter
  • Instagram
  • YouTube
  • LinkedIn
  • Zenfolio

Department of Geographical Sciences

2181 Samuel J. LeFrak Hall, 7251 Preinkert Drive,
University of Maryland, College Park, MD 20742
Phone: 301-405-4050

Join Our Newsletter

Contact Us

Links
  • UMD Land Acknowledgement
  • UMD Staff Directory
  • Give to GEOG
  • UMD Web Accessibility
  • Alumni
© 2025 College of Behavorial & Social Sciences. All Rights Reserved.
Login